Microsoft announced a new public preview which contains the new Microsoft Sentinel Health Monitoring feature. Microsoft Sentinel now provides the SentinelHealth data table to help monitor the connector health and provides some insights which are interesting for further monitoring.
Important: Feature currently in public preview. Article updated 27 January 2022
Introduction
With the new Microsoft Sentinel Health Monitoring feature, it is possible to check the health of the Microsoft Sentinel instance. (Analytics rules, Data Connectors)
When using Microsoft Sentinel in production it is critical to monitor your connector health and view any item which is not working correctly – such as authentication, throttling, and more. Of course, it is the best situation you receive an email message, Teams message, or ticket in a servicing ticketing/ alert system which gives the error message.
In this blog, I will explain the usage of the new Microsoft Sentinel health Monitoring functionality and show some options for sending alerts with the usage of Logic App and Teams Adaptive Cards.
For viewing insights on health drifts the new SentinelHealth data table is available – including the failure events for each connector.
Currently, the Sentinelhealth data table is only supported for the following data connectors:
- Amazon Web Services (CloudTrail)
- Dynamics 365
- Office 365
- Office ATP
- Threat Intelligence – TAXII
- Threat Intelligence Platforms
Enable Health Monitoring
Enabling this new feature requires enablement in the Microsoft Sentinel console:
- Open Microsoft Sentinel and the correct Sentinel workspace
- Go to Settings(1) in the left menu, then access the settings tab at the top(2)
- Open the Health Monitoring section (3) on the settings page and click Configure Diagnostic settings (4)

- To turn on Microsoft Sentinel’s health monitoring feature, select Configure diagnostic settings (4) and configure the correct destination details. When needed you can select additional workspaces part of the destinations.
- Click on Add diagnostic settings (5)

- Fill in the name – select allLogs or only DataConnectors logs and configure the correct destination. For using the Sentinel workspace select Send to Log Analytics workspace and select subscription and the correct Log Analytics workspace. Other options are; archive to a storage account, event hub, or send to partner solution.

- Now it takes some time. The SentinelHealth data table is created at the first success or failure event generated for the data connectors.
Reviewing data – overview
After the first success or failure event, the new SentinelHealth table is directly visible in Log Analytics. The following types of events are part of the SentinelHealth table:

Data fetch status change:
Data fetch status changes events are logged once an hour as long as a data connector status remains stable. If the data connector’s status changes, either from success to failure, from failure to success, or has changed in failure reasons, the event is logged immediately. More information is available on docs.microsoft.com

Failure summary:
Failure summary is created once an hour, for each connector, per workspace. Failure summary events are created only when the connector has experienced polling errors during the given hour. More information is available on docs.microsoft.com

Below columns are available in the new Sentinelhealth table:
- TenantId
- TimeGenerated
- OperationName
- SentinelResourceId
- SentinelResourceName
- Status
- Description
- WorkspaceId
- SentinelResourceType
- SentinelResourceKind
- RecordId
- ExtendedProperties
View docs.microsoft.com for the complete schema description.
Reviewing data – alert
When looking from the event Data fetch status change the columns gives more sense. The below example show the data fetch status change(1) for the connector group Office 365(2) and Data Connector name Office 365-Audit.Exchange(3).
Data fetch failed(4) with the reason SC20011(5) which gives the description: Data fetch failed (Tenant does not exist in the O365 Management API)(6)

Other critical information for the identification is available; TenantId, TimeGenerated, ResourceID, WorkspaceID, and ExtendedProperties in JSON format. RecordId contains a unique identifier that can be shared with the support team for better correlation.
Microsoft Sentinel shows no alert directly on the Office365 connector page for the detailed description. Part of the SentinelHealth table is the description that gives the error: Data fetch failed ( Tenant does not exist in the O365 Management API ). Below are the mappings between SentinelHealth data and Office 365 connector page.

Queries/ Hunting
For more visibility create queries on the SentinelHealth table to detect health connectors. Below are some examples:
Latest failure events for each connector last day (source Microsoft)
SentinelHealth
| where TimeGenerated > ago(1d)
| where OperationName == 'Data fetch status change'
| where Status in ('Success', 'Failure')
| summarize TimeGenerated = arg_max(TimeGenerated,*) by SentinelResourceName, SentinelResourceId
| where Status == 'Failure'Show all Sentinelhealth events in the last 24 hours (including summary, failed analytics rules, and succeded events):
SentinelHealth
| where TimeGenerated >= ago(1d)Detect connectors changed from success to fail in the last 12 hours (source Microsoft)
let lastestStatus = SentinelHealth
| where TimeGenerated > ago(12h)
| where OperationName == 'Data fetch status change'
| where Status in ('Success', 'Failure')
| project TimeGenerated, SentinelResourceName, SentinelResourceId, LastStatus = Status
| summarize TimeGenerated = arg_max(TimeGenerated,*) by SentinelResourceName, SentinelResourceId;
let nextToLastestStatus = SentinelHealth
| where TimeGenerated > ago(12h)
| where OperationName == 'Data fetch status change'
| where Status in ('Success', 'Failure')
| join kind = leftanti (lastestStatus) on SentinelResourceName, SentinelResourceId, TimeGenerated
| project TimeGenerated, SentinelResourceName, SentinelResourceId, NextToLastStatus = Status
| summarize TimeGenerated = arg_max(TimeGenerated,*) by SentinelResourceName, SentinelResourceId;
lastestStatus
| join kind=inner (nextToLastestStatus) on SentinelResourceName, SentinelResourceId
| where NextToLastStatus == 'Success' and LastStatus == 'Failure'Monitoring/sending alerts
Monitoring Microsoft Sentinel connectors is crucial to keep the environment stable and secure. You need to know directly when a Sentinel data connector shows failure events or critical health activity. For notifications multiple options are available;
- Logic App (Send e-mail)
- Logic App (Send Teams chat/ message)
- Azure Monitor alert rules
- Sentinel Analytics rules
If you want to be notified and take immediate action for health alerts part of Microsoft Sentinel; Logic App or Azure Monitor alert rules sounds usable) For Azure Monitor alerts read the following Microsoft page.
One example part of this blog:
- Logic App
Notice: This blog will show the concept for Logic apps. Of course, more advanced LogicApp and detection logic can be used for closing automated alerts or integrations directly to tools like ServiceNow.
Logic App – notification
Logic App can be used for triggering events based on the KQL query. For the configuration of the app flow, which is needed for sending automated actions – I am using the Logic Apps Designer and selecting the start template Blank Logic App. For more information around Logic App creation check the blog.
Schedule trigger
The first start point is the “Schedule” and uses the “Recurrence” as a trigger. Recurrence is used for selecting the interval frequency.

For example, set the flow for a run every hour, ensuring new alerts are visible within an hour timeframe. Of course, more frequent recurrence is always possible.

Get KQL Log Analytics results
Next up, we will use the first action to run the KQL query against the configured Log Analytics workspace. Search the action Run Query and list results part of the Azure Monitor Logs.

Configure the Subscription, Resource Group, Resource Type, Resource Name and fill in the KQL query.
KQL query contains the “SentinelHealth table” and OperationName “Data fetch status change” For now only the status “Failure” is filtered.
SentinelHealth
| where OperationName == 'Data fetch status change'
| summarize TimeGenerated = arg_max(TimeGenerated,*) by SentinelResourceName, SentinelResourceId
| where Status == 'Failure'Use the control For Each – for running the action for each unique result part of the results. The output used is based on the value of the previous step.

Now configure a condition where the Status is equal to Failure. (already part of the query, more for extra validation the rule is not sending succeded events).

Now we can create a specific action for each result where the action is equal to Failure. Multiple options are available for sending specific actions using Logic App. For example, send an automated mail including all the properties or send a Teams message.
Teams channel message
For sending Teams messages the action item: Microsoft Teams > Post adaptive card in a chat or channel can be used, when the result of the previous condition is true. Post adaptive card will be used to post the status of the Health Monitoring in Teams.

Configure the following options:
- Post as: Flow Bot
- Post in: Chat with Flow bot or Channel
- Team: When post in channel is selected, configure the selected Teams. Example shows: SOC Security Monitoring
- Channel: When post in channel is selected, configure the correct Teams channel part of the Team.
- Adaptive Card: Provide the configuration which includes the JSON card layout. For creating JSON card layout the adaptivecards.io designer is recommended. Part of the JSON are the properties part of the previous results.
{
"type": "AdaptiveCard",
"body": [
{
"type": "TextBlock",
"size": "Medium",
"weight": "Bolder",
"text": "⚠️Sentinel Health Warning detected ⚠️"
},
{
"type": "TextBlock",
"text": "Please take action by reviewing the Sentinel Health State Alerts. Warning detected part of the @{items('For_each')?['SentinelResourceKind']}connector.",
"wrap": true
},
{
"type": "TextBlock",
"text": "General details",
"wrap": true,
"weight": "Bolder"
},
{
"type": "FactSet",
"facts": [
{
"title": "Status",
"value": "@{items('For_each')?['Status']}"
},
{
"title": "Time Generated",
"value": "@{items('For_each')?['TimeGenerated']}"
},
{
"title": "Sentinel Connector",
"value": "@{items('For_each')?['SentinelResourceKind']}"
},
{
"title": "Sub connector",
"value": "@{items('For_each')?['SentinelResourceName']}"
},
{
"title": "TenantID",
"value": "@{items('For_each')?['TenantId']}"
}
],
"separator": true,
"spacing": "Medium"
},
{
"type": "TextBlock",
"text": "Advanced Details",
"wrap": true,
"weight": "Bolder"
},
{
"type": "FactSet",
"facts": [
{
"title": "Reason",
"value": "@{items('For_each')?['Reason']}"
},
{
"title": "Description",
"value": "@{items('For_each')?['Description']}"
},
{
"title": "RecordID",
"value": "@{items('For_each')?['RecordId']}"
}
],
"separator": true
},
{
"type": "ActionSet",
"actions": [
{
"type": "Action.OpenUrl",
"title": "Open Microsoft Sentinel instance",
"url": "COPY SELECTED URL"
}
]
}
],
"$schema": "http://adaptivecards.io/schemas/adaptive-card.json",
"version": "1.4"
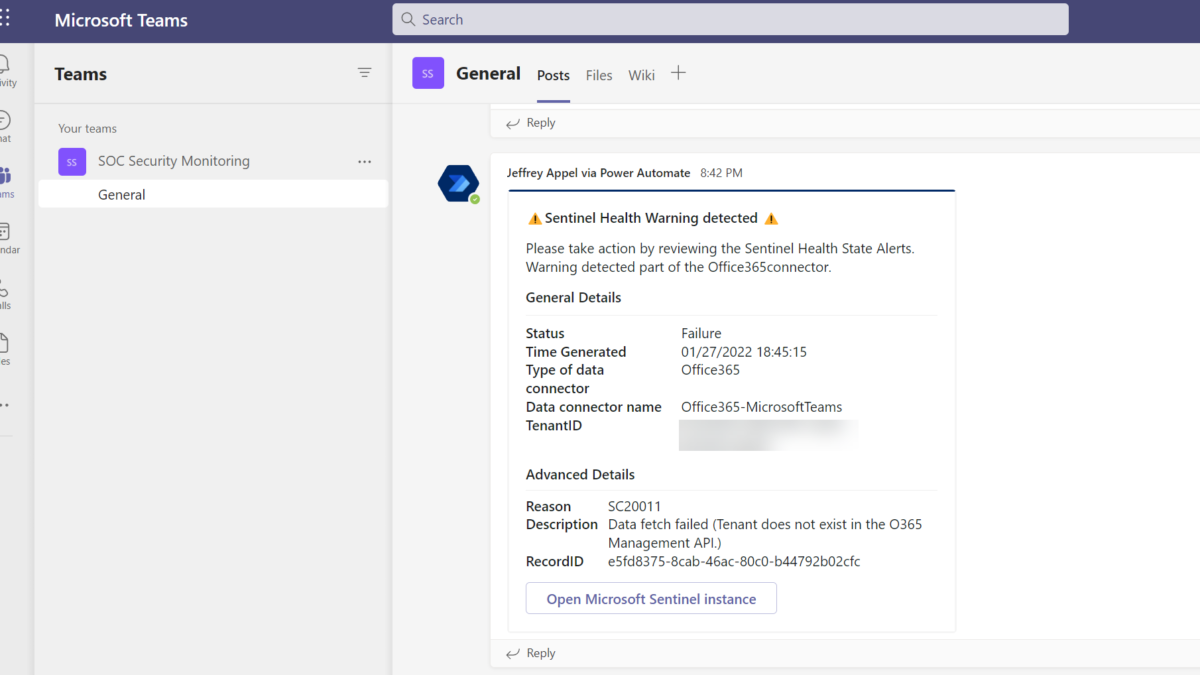
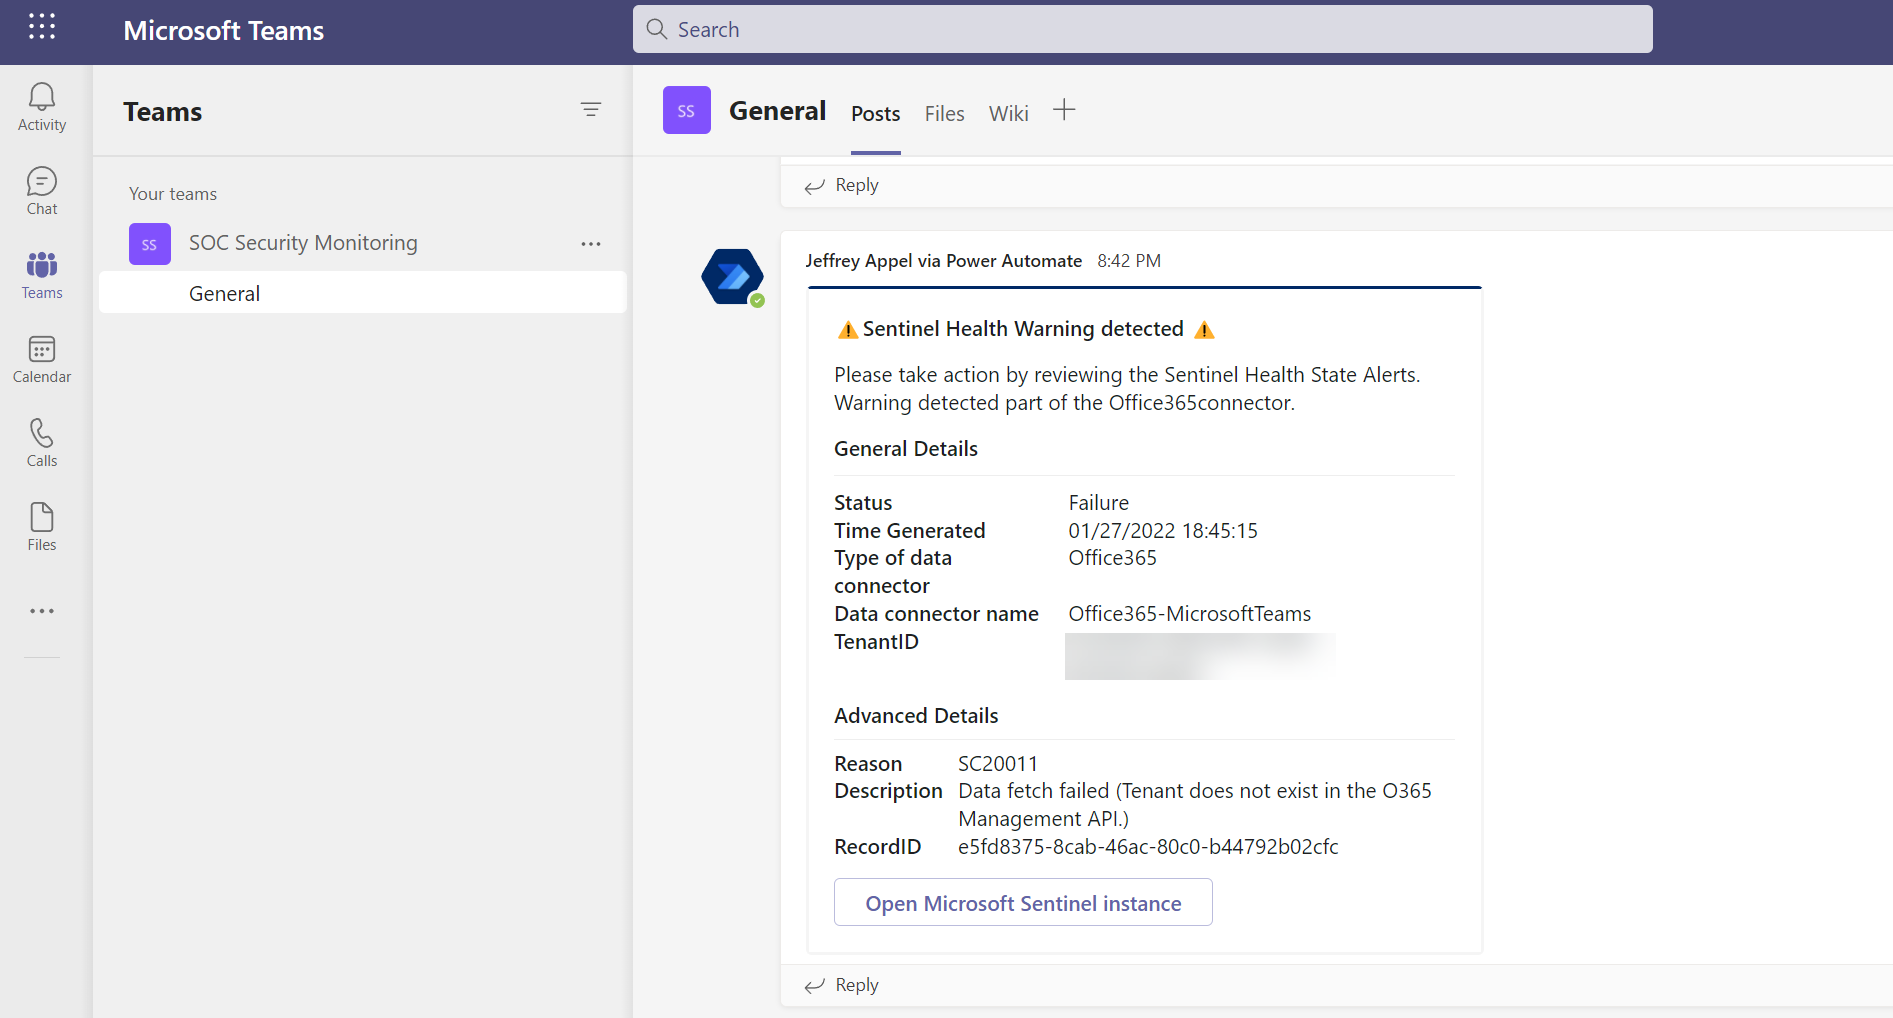
}This example posts a message to the Teams channel SOC Security Monitoring including all the information for each health alert and unique connector. Part of the JSON layout is a clear title and descriptions. For the General details and advanced details, all properties are used from the earlier KQL results. Below is the experience of the adaptive card for each alert.

The completed flow
1: Recurrence for each hour
2: Run Query against Log Analytics workspace and list result
3: For each unique value based on the results
4: Filter on condition status failure
5: When true; post adaptive card in Teams channel including all information.

Conclusion
The purpose of this blog was to give you some insights on what you can accomplish with the new Microsoft Sentinel Health monitoring feature which is currently in preview for some connectors.
With the use of Logic App, Azure Monitor way more options are available for monitoring analytics rules and data connectors. Stay tuned for more related blogs around Sentinel health monitoring, automated actions, and reporting.
Suggestions for new topics? Contact me on the socials or send a mail.
Sources
Microsoft Docs: Monitor the health of your data connectors