Live response is a function from Defender for Endpoint and is available for Windows 10 and Server 1803/1903. Live response gives security operations teams instantaneous access to a device using a remote shell connection. With live response it is possible to do an in-depth investigation and take immediate actions on the device level without any user interaction.
With live response the following tasks are possible.
- Run basic and advanced commands to do investigative work on a device.
- Download files such as malware samples and outcomes of PowerShell scripts.
- Download files in the background (new!).
- Upload a PowerShell script or executable to the library and run it on a device from a tenant level.
- Take or undo remediation actions.
With the new Public Preview announcement from Microsoft, it is possible to start Live Response actions directly from the API. With this multiple use-cases are possible with Defender for Endpoint and Sentinel for further investigation and triggers.
This blog is about the basic integration with Azure Sentinel Automation/Playbooks and the integration with Azure Sentinel for starting Live Response actions.
With the API and the usage of live response multiple scenarios are available. For example:
- Run forensics toolings and export the result automatically into Storage Accounts
- Run Memory dump or other forensics toolings in case of critical incident
- Run PowerShell commands to get information from the system Example: Get-MpComputerStatus and add them into Sentinel.
During this blog the demo of connecting Azure Sentinel with the Live Response API to manually run a PlayBook trigger from an alert. In coming blogs the above scenarios will be explained more.
Notice: This blog contains only the basic parts based on the preview to run a Playbook from Sentinel. For showing the available options. Write/Get actions to Sentinel is coming in a future blog post.
Live response functionality
First some explanation about the live response function. Live response is a capability that gives you instant access to a machine using a remote shell connection. Since 2019 part of the Defender for Endpoint solution.
First, we need to ensure that the setting is enabled in Defender for Endpoint. For enabling live response:
- Go to security.microsoft.com
- Open Settings -> Endpoints -> Advanced features
- Enable the feature Live Response and Live response for servers

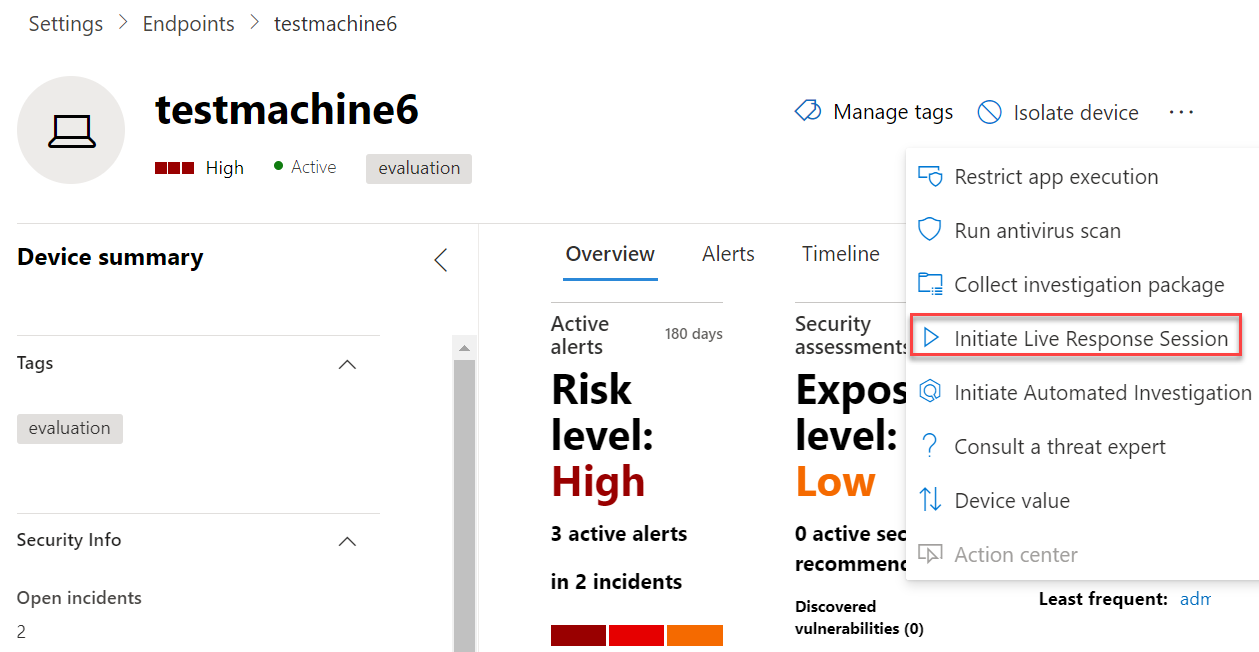
After enablement, we can start to initiate a live response session on an affected device. The live response session action is available from the device action page.

Now the live response session is started with the Sense IR is running and registered state. Time to run and start commands. In a critical situation it is also possible to isolate the machine first from the network by selecting isolate machine, after the isolate it is still possible to run a live respose session.

Currently, a couple of commands are available. Press HELP for all the available commands available. In case of specific HELP details. Press HELP and the command-name. Example: HELP processes. The interface gives options to output results to your Windows client by simply pipe the JSON output Example: drivers -output json > drivers.txt

More information about Live response: M365internals.com & Microsoft
Now it is time for fun and using the new API function to trigger live response actions from the Sentinel playbook.
Live response API
With the API and the usage of live response multiple scenarios are available. For example:
- Run forensics toolings and export the result automatically into Storage Accounts
- Run Memory dump or other forensics toolings in case of critical incident
- Run PowerShell commands to get information from the system Example: Get-MpComputerStatus
During this blog the demo of connecting Azure Sentinel with the Live Response API to manually run a PlayBook trigger from an alert.
The live response APIs supports multiple ways to run and collect information and take real-time actions on a remote endpoint using the APIs. With the possibility to run PowerShell scripts a lot of scenario’s are available.
Good to know; The live response API is supporting the following OS systems:
- Windows 10
- Windows Server 2019
The following commands are available:
Live Response Library
For using the PowerShell scripts it is required to upload the PowerShell script to the Library. For uploading script files into the Live Response Library follow the steps below:
- Go to Security.microsoft.com
- Open the device page
- Click: Initiate Live Response Session
- Now upload the file with the button: Upload file to library
Validate the library context with the command Library
Used script during this blog:
<# .Synopsis Sample script to export all Scheduled Tasks #> Get-ScheduledTask | Get-ScheduledTaskInfo | Export-csv "C:\Windows\Temp\ScheduledTasks.csv" -NoTypeInformation -Force Get-Service | Export-csv "C:\Windows\Temp\Services.csv" -NoTypeInformation -Force Get-Process | Export-csv "C:\Windows\Temp\Processes.csv" -NoTypeInformation -Force
Prepare the Logic Apps rights
For the logic app the Machine.LiveResponse permission is required to call the live response API.
| Permission type | Permission | Permission display name |
|---|---|---|
| Application | Machine.LiveResponse | Run live response on a specific machine |
| Delegated (work or school account) | Machine.LiveResponse | Run live response on a specific machine |
Multiple ways are available for authenticating the Logic App. In this demo example the Active Directory OAuth type is used. For authenticating with the OAuth type create an App Registration with a Secret Key.
Make sure the app registration contains the WindowsDefenderATP Machine.LiveResponse permission and consent the rights for the complete tenant.

Azure Sentinel Logic app permissions
Azure Sentinel must be granted explicit permissions in order to run playbooks from automation rules. If a playbook appears “grayed out” in the drop-down list, it means Sentinel does not have permission to that playbook’s resource group.
For assigning permissions:
- Open Azure Sentinel
- Go to Settings
- Go to Playbook Permissions -> Configure permissions
- Select the resource groups and assign permissions

Create the logic app
The first start point for the logic app is the Azure Defender alert response. In the case of this blog, the start point is the trigger: When a response to Azure Sentinel alert is triggered

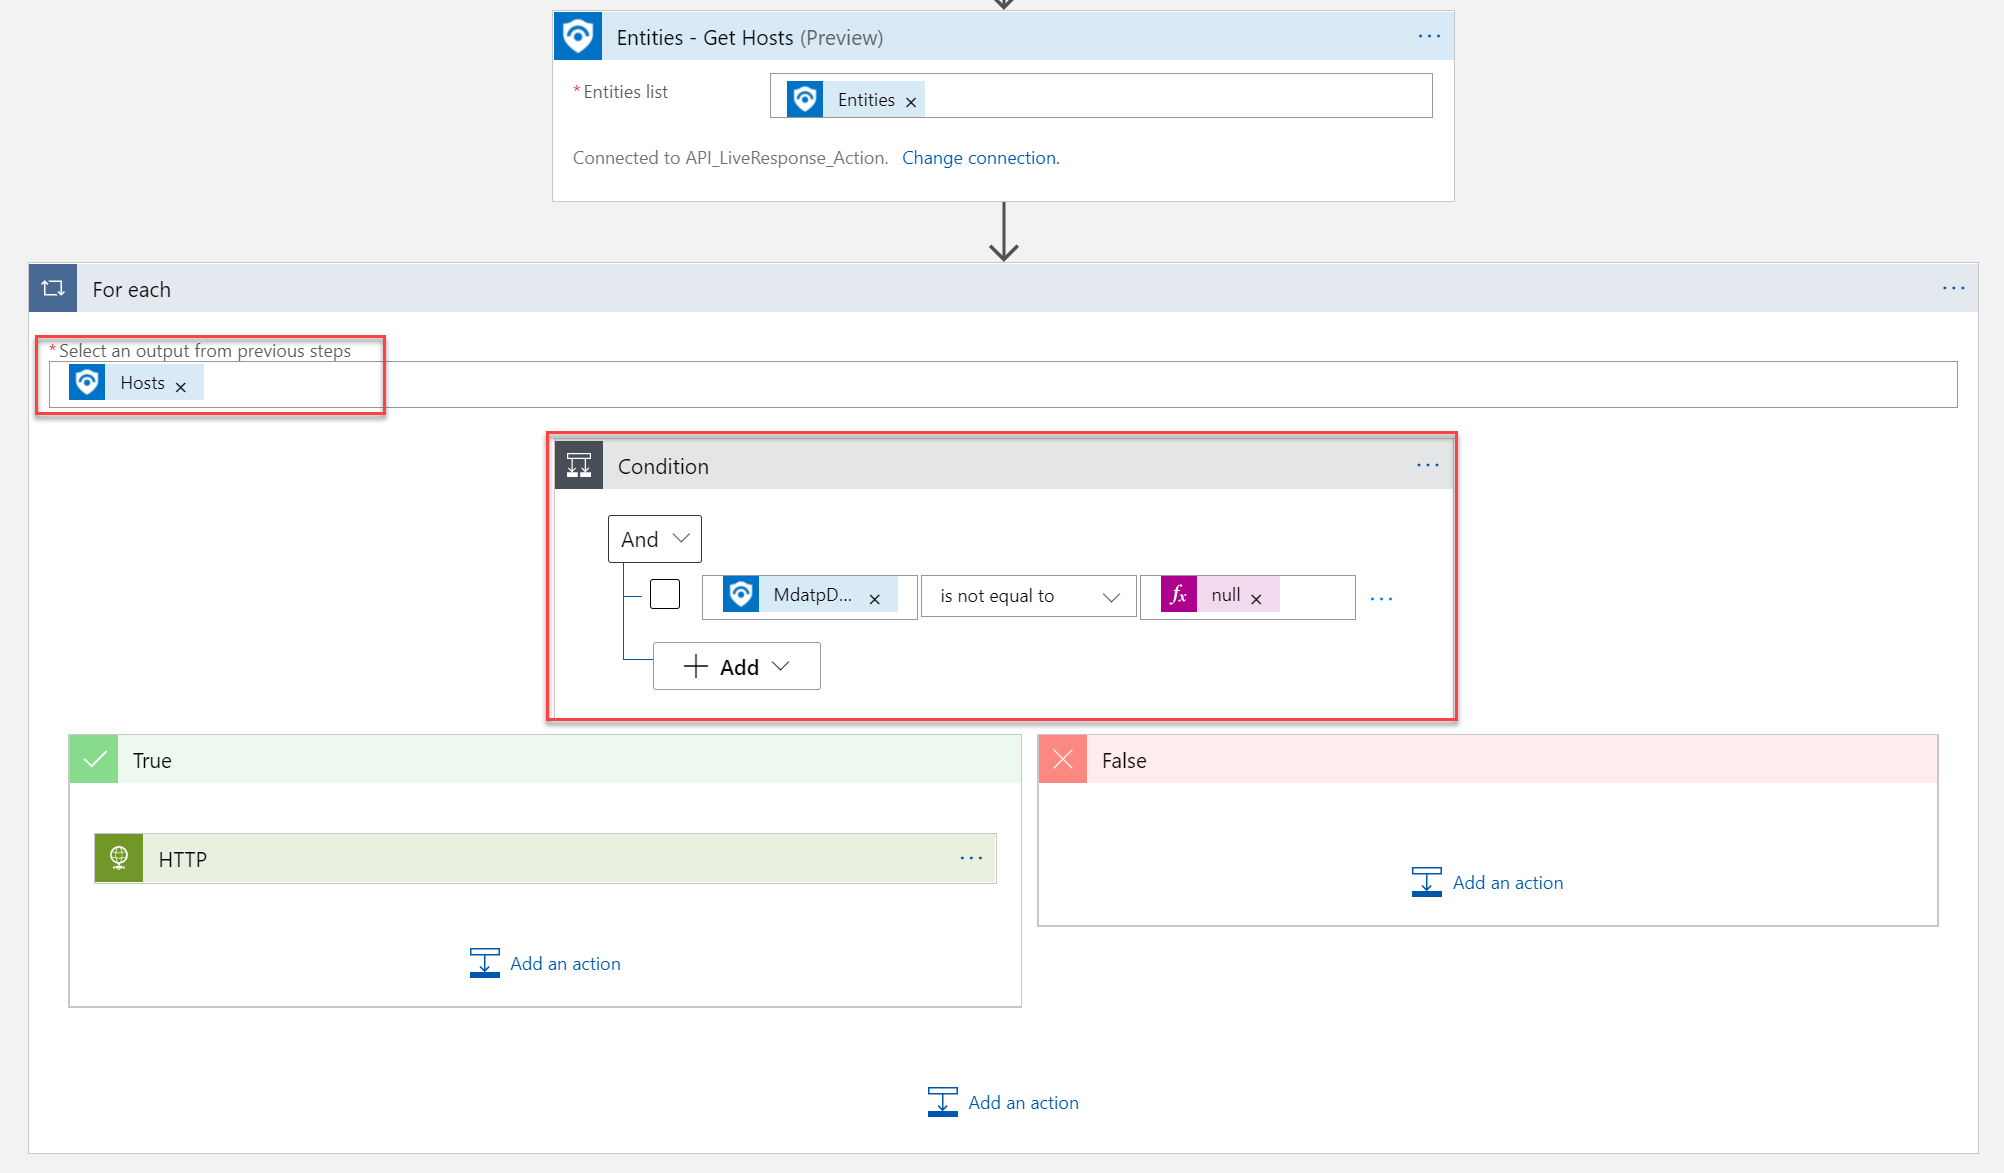
Azure Sentinel provides the trigger, then we get the entity/ host information with the Get-Hosts action. For each Host with the Condition: MDATPDeviceID is not equal to null the HTTP post request will be sent out to trigger the Live Response action.
Important to get the MdatpDeviceID. The Host ID from Sentinel is not working for Defender for Endpoint actions. The MdatpDeviceID is part of the Get-hosts Entities list.
Part of the Get-Hosts entities MdatpDeviceID and more related information for further scenarios.
Update 23-11-2021: MdatpDeviceId data field can be different. If the data is not part of the host field ( below screenshot). Try the following path: (‘For_each’)?[‘additionalData’]?[‘MdatpDeviceId’])}/runAntiVirusScan”

For running only the action based on the available MdatpDeviceID item. I created a For each condition based on the Host output. For each Host with the Condition: MDATPDeviceID is not equal to null the HTTP post request will be sent out to the True trigger.

For the True trigger it is possible to run the API request based on the HTTP post action.
For the life response machine action the following API is available: https://api.securitycenter.microsoft.com/api/machines/{machine_id}/runliveresponse
For the MachineID use the MDATPDeviceID attribute from the Get-Hosts action:

For the Body fill in the JSON layout with the type RunScript included. Use the script name uploaded to the library. Example:
{
"Commands": [
{
"params": [
{
"key": "ScriptName",
"value": "forensics.ps1"
},
{
"key": "Args",
"value": "forensics"
}
],
"type": "RunScript"
},
{
"params": [
{
"key": "Path",
"value": "C:\\windows\\Temp\\Services.csv"
}
],
"type": "GetFile"
}
],
"Comment": "Testing Live Response API"
}
For starting the live response action the commands RunScript are available for running the script from the library on a device. More information here about the RunScript commands.
Now it is needed to give the API call permission with the App Registration or any other authentication solution. In this case the permission is validated with the OAuth type.

Complete overview of the Logic App:

Azure Sentinel Playbook
Of course with Sentinel it is possible to run the live response based on Automation. For now the action is manually started from the created Defender for Endpoint alerts. For viewing the available playbooks. Click View playbooks.

Now run the created playbook for starting the live response action:

Validate the Logic App output
Now validating the Logic App output to confirm the correct values:
From the Alert trigger the following events are available:
- Alert information from trigger
- MdatpDeviceID

From the Get Host trigger the following data is available:
3. MdatpDeviceID

4. Based on the MdatpDevieID condition the For each control is passed to true:

For the HTTP Post request the following details are containing in the input:
5. URL with MachineID
6. Body context with JSON
7. Authentication completed with OAuth

With the final output:
- Status code: 201
- Machine ID filled in for further machine actions and get-commands
- Command status: Created

Validate the Device action
For test collecting with Powershell the ScheduledTask/ Get-Service and Get-Process and export the results located to the temp folder as a .csv file.
End result: All files are created from the live response action.

Conclusion
The new API features give interesting functions related to collecting forensic details from Sentinel alerts. With playbooks/ automation and automated actions multiple scenarios are possible. During the next blogs more interesting situations will be explained. For example nice topics:
- Run forensics toolings and export the result automatically into Storage Accounts
- Run Memory dump or other forensics toolings in case of critical incident
- Run PowerShell commands to get information from the system Example: Get-MpComputerStatus
The next part is focused on the Get Live response results added into Azure Sentinel comments/ data.
Sources
Microsoft Live response API:
Microsoft announcement:


Hey! great article here, love the detail. Do you have an opinion on how to set up alerting in Sentinel for when Live Response is triggered?