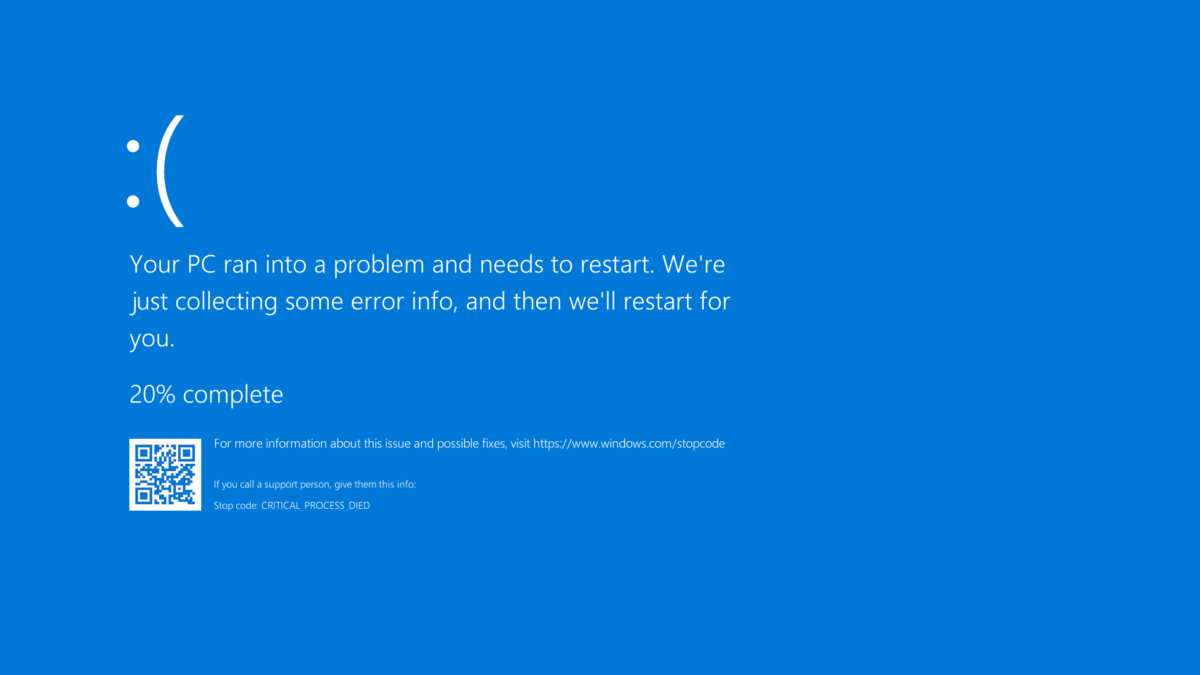
A well-running workplace environment is critical to have a great endpoint user-experience. With a not stable configuration/ device the productivity is not the best part. Worst case scenario ( blue screens), they may even lose the work that they just did create and useful time. For IT service desk people always a difficult issue based on the latest minimal report information from a ticket or call. With Endpoint Analytics it is possible to view more details about the restart frequency and application reliability from a device and model view.
With the new Endpoint Analytics features is it possible to get more insights into the application reliability and device restart frequency. The new insights give more visibility and insights to improve the optimal user experience.
Since the latest release, multiple new insights are available in public preview.
- Application reliability
- Restart frequency
What is needed for Endpoint Analytics?
Endpoint Analytics is part of Microsoft Endpoint Manager and combines the information with the productivity Score.
For Endpoint Analytics some pre-requisites are needed. For onboarding management from Endpoint Manager and Endpoint Configuration manager is possible.
Requirements
Intune
- Intune enrolled or co-managed device
- Windows 10 Pro, Windows 10 Enterprise, or Windows 10 Education
- Startup performance available from 1903 or later
- Windows 10 devices must be Azure AD Joined or Hybrid Azure AD Joined
- Network connectivity
Configuration manager ( tenant attach)
- Configuration manager version 2002 with KB4560496 installed
- Configuration manager clients upgraded to version 2002
- Tenant attach enabled
License
Devices enrolled in Endpoint analytics need a valid Microsoft Endpoint Manager license. Proactive remediations require one of the following licenses:
- Windows 10 Enterprise E3 or E5 (included in Microsoft 365 F3, E3, or E5)
- Windows 10 Education A3 or A5 (included in Microsoft 365 A3 or A5)
- Windows Virtual Desktop Access E3 or E5
More requirements information; view docs.microsoft.com
First, make sure all the prerequisites are in place and configured before enabling Endpoint Analytics. In this blog only the Endpoint Manager technical configuration is explained. As described in the introduction onboarding with configuration manager is possible.
Onboarding from the Endpoint analytics is easy for Intune-only devices.
- For the Endpoint Analaytics onboarding wizard go to: https://endpoint.microsoft.com/#blade/Microsoft_Intune_Enrollment/UXAnalyticsMenu/overview
- Select all cloud-managed devices or a selected group
- Click start. With clicking start it will automatically assign a new configuration profile to collect the data from all scoped devices. It is possible to change the scoped devices later.
It can take up to 24 hours after creating the setting to populate data from your devices after they report.

Now if you check the device profiles a new Windows Health Monitoring profile is created for collecting the data. By default, the default policy is assigned to all devices. Of course it is possible to change the deployment settings for a specific scope.

After some hours the first data will be available inside the Endpoint Analytics overview. For startup performance, the device needs to have been restarted at least once.

Device restart frequency
Device restarts are needed for security updates and installing updates on devices. The only issue, you take a look at the client view for restart settings.
With the new insight device restart frequency, it is possible to get more information about device restarts. Microsoft productivity score gives the reboot multiple groups. You have two different reboot groups: Normal and Abnormal
Normal:
- Reboot
- Windows Update
- Windows Shutdown process
- Shutdowns to save battery power
Abnormal:
- Blue screens
- Long power button press restart ( most of the times freezing computer)
- Unknown
For the performance view, normal reboots are needed for patching and keep the device secure. Abnormal is frustrating and not needed on devices. Blue screens are possible from an application error or driver issue for example. It would be nice if you can see the blue screen frequencies for specific model groups and devices.
To view the new report:
- Open Endpoint Analytics and go to the restart frequency(preview) tab. Endpoint analytics – Microsoft Endpoint Manager admin center
- Open Restart Frequency

Inside the restart frequency dashboard you can find multiple information sources. First off all you can find the restart frequency metrics for the last 14 days. This gives a short overview of the specific restart sources/types.
- Any restart: Device restarted for any reason
- Blue screen: Device with blue screen abnormal reboot
- Long power-button press: Devices shutdown by holding the power button down
- Update: Device restarted during update install
- Restart (no update): Device restarted when no update was pending
- Shutdown (no update): Device was powered off when no update was pending
- Unknown: Abnormal shutdown that was neither a blue screen nor a long power-button press
For a Blue screen reboot a typical count is 2 per device per year for new recent hardware.


Device and model performance tab
In the device performance tab, two default columns have been added with the new preview feature. With this you can review the total number of restarts and the number of blue screens viewed from a computer view.

In the model performance tab, two default columns have been added so you can review both the average number of restarts and the average number of blue screens (stop errors) per model over the last 14 days.

From the device page more specific information is available for the restart category with if available also a stop code from the blue screen page. The OS restart history table is truncated to the 10 most recent restarts that occurred in the last 2 months. New restarts are showing up before the daily device performance view.

Application reliability
The application reliability report is currently in preview and gives insight into the application reliability and a baseline scored based on all commercial organizations.
The list of apps showed gives the most productivity issues ( application reliability) during the last 14 days. This contains application issues and crashing information from devices. On the right column the insights and recommendations are visible based on the priority for the most user improvement score.
With the App performance all the organization’s apps are listed based on name, publisher, active devices and the app reliability score. The information is also listed for each specific model, device or OS version. With this information it is possible to detect issues based on hardware and specific configurations.
Clicking into each device gives more specific information based on a timeline with all the app events. Useful for troubleshooting and understand the issues from the end-user better from the IT-view.
Source:
Microsoft: Restart frequency (preview) in endpoint analytics
Microsoft: What is Endpoint analytics?